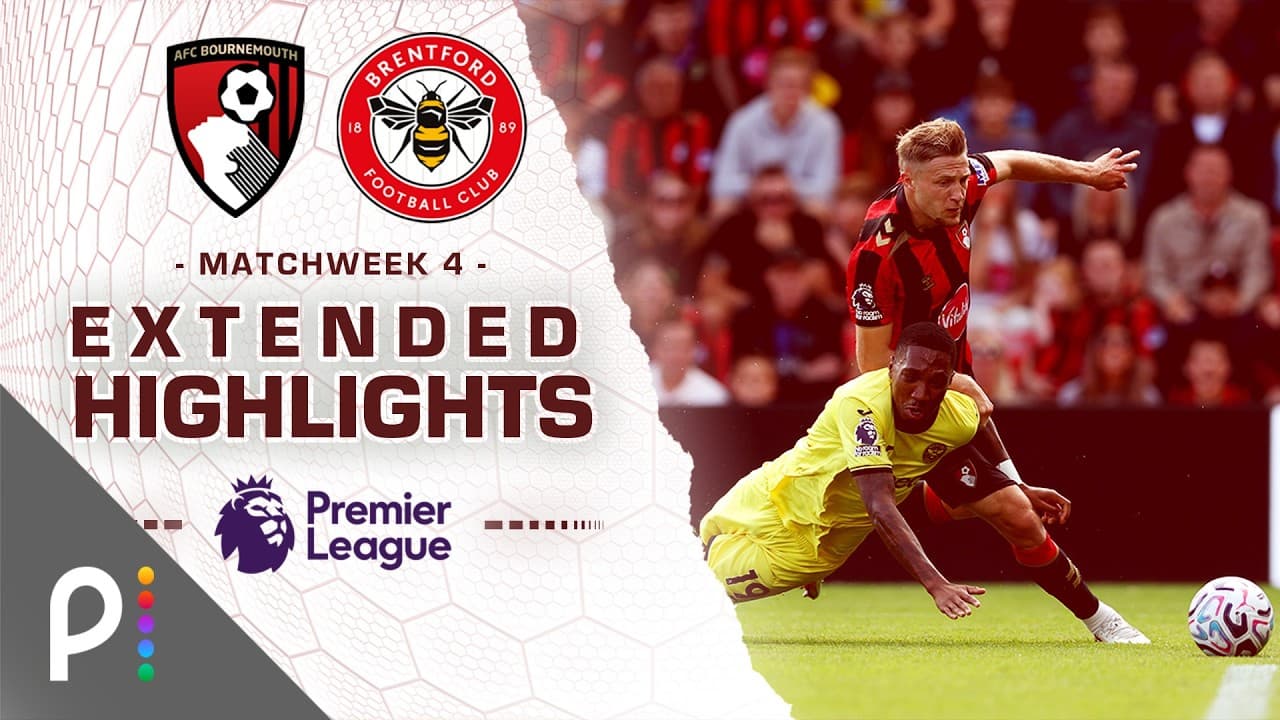
Brentford vs. Brighton Highlights (Feb 21)
Premier League 2025/26

Premier League 2025/26

| # | GP | W | D | L | DIFF | Goals | Pts | |
|---|---|---|---|---|---|---|---|---|
| 1 | 38 | 26 | 7 | 5 | +44 | 71:27 | 85 | |
| 2 | 38 | 23 | 9 | 6 | +42 | 77:35 | 78 | |
| 3 | 38 | 20 | 11 | 7 | +19 | 69:50 | 71 | |
| 4 | 38 | 19 | 8 | 11 | +7 | 56:49 | 65 | |
| 5 | 38 | 17 | 9 | 12 | +10 | 63:53 | 60 | |
| 6 | 38 | 13 | 18 | 7 | +4 | 58:54 | 57 | |
| 7 | 38 | 14 | 12 | 12 | -6 | 42:48 | 54 | |
| 8 | 38 | 14 | 11 | 13 | +6 | 52:46 | 53 | |
| 9 | 38 | 14 | 11 | 13 | +3 | 55:52 | 53 | |
| 10 | 38 | 14 | 10 | 14 | +6 | 58:52 | 52 | |
| 11 | 38 | 15 | 7 | 16 | -4 | 47:51 | 52 | |
| 12 | 38 | 14 | 7 | 17 | -2 | 53:55 | 49 | |
| 13 | 38 | 13 | 10 | 15 | -3 | 47:50 | 49 | |
| 14 | 38 | 11 | 14 | 13 | -7 | 49:56 | 47 | |
| 15 | 38 | 11 | 12 | 15 | -10 | 41:51 | 45 | |
| 16 | 38 | 11 | 11 | 16 | -3 | 48:51 | 44 | |
| 17 | 38 | 10 | 11 | 17 | -9 | 48:57 | 41 | |
| 18 | 38 | 10 | 9 | 19 | -19 | 46:65 | 39 | |
| 19 | 38 | 4 | 10 | 24 | -37 | 38:75 | 22 | |
| 20 | 38 | 3 | 11 | 24 | -41 | 27:68 | 20 |
Brentford and Brighton locked horns in a Premier League clash on February 21st, 2026. The atmosphere was tense as both sides looked to assert dominance and secure vital points in the competitive league campaign.
Brentford exerted significant pressure throughout the initial phase, as evidenced by their 52% possession and a notable 74 passes into the final third. They created three big chances, hinting at periods of attacking intent and promising build-up play. Despite their efforts to penetrate the Brighton defence, the Seagulls managed to hold firm, limiting the direct threat on their goal. The Bees' passing game saw them connect 343 times successfully, demonstrating a desire to control the tempo and work openings.
The home side's attacking strategy involved 21 crosses, with six finding their mark, indicating a willingness to test the opposition aerially and with wide play. Their expected goals metric suggested they were carving out opportunities, even if not always converting them into clear-cut shots on target. Brighton, meanwhile, focused on defensive solidity, absorbing Brentford's advances and looking to counter when the opportunity arose, though concrete chances for them were not detailed in the statistics.
As the match progressed, the tactical battle continued, with Brentford aiming to break the deadlock. Their 1.6 expected goals figure throughout the contest points to a sustained attacking effort, supported by 8 key passes that unlocked Brighton's rearguard at times. The defensive statistics show Brentford were active, with 6 successful tackles and 10 interceptions, highlighting their commitment to winning the ball back and stifling Brighton's attempts to build momentum.
The game saw a total of 13 shots on and off target combined, suggesting a relatively tight affair where clear-cut scoring opportunities were at a premium for both sides. Brighton's defensive resilience was key, and while Brentford's attacking statistics paint a picture of a team that created chances, the final scoreline would reflect the effectiveness of both teams' defensive organisation. The match ultimately ended with neither side able to claim a decisive victory.
Ultimately, the encounter showcased Brentford's ambition to control possession and create through intricate build-up play, while Brighton demonstrated their capacity for defensive organisation. The statistics suggest a game where Brentford had the edge in terms of creating attacking situations, but the inability to convert these into decisive goals meant the points were shared, a testament to Brighton's resolute defending throughout the Premier League fixture.